Page 13 - Turning Trash to Treasure: Development of Waste-to-Energy Technologies
P. 13
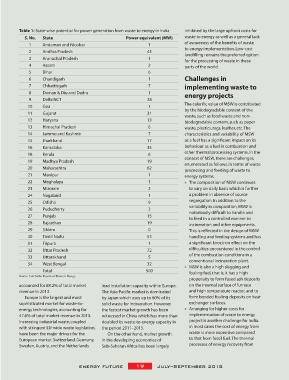
Table 1: State-wise potential for power generation from waste to energy in India inhibited by the large upfront costs for
S. No. State Power equivalent (MW) waste to energy as well as a general lack
of awareness of the benefits of waste
1 Andaman and Nicobar 1
2 Andhra Pradesh 43 to energy implementation. Low-cost
landfilling remains the preferred option
3 Arunachal Pradesh 1 for the processing of waste in these
4 Assam 2 parts of the world.
5 Bihar 6
6 Chandigarh 1 Challenges in
7 Chhattisgarh 7 implementing waste to
8 Daman & Diu and Dadra 1 energy projects
9 Delhi NCT 28
10 Goa 1 The calorific value of MSW is contributed
by the biodegradable content of the
11 Gujarat 31 waste, such as food waste and non-
12 Haryana 13 biodegradable content, such as paper
13 Himachal Pradesh 6 waste, plastics, rags, leather, etc. The
14 Jammu and Kashmir 7 characteristics and variability of MSW
15 Jharkhand 17 as a fuel has a significant impact on its
16 Karnataka 35 behaviour as a fuel in combustion and
18 Kerala 6 other thermal processing systems. In the
19 Madhya Pradesh 19 context of MSW, there are challenges,
enumerated as follows, in terms of waste
20 Maharashtra 62 processing and feeding of waste to
21 Manipur 1 energy systems.
22 Meghalaya 1 » The composition of MSW continues
23 Mizoram 2 to vary on daily basis which is further
24 Nagaland 1 a problem in absence of source
25 Odisha 9 segregation. In addition to the
26 Puducherry 2 variability in composition, MSW is
notoriously difficult to handle and
27 Punjab 15
to feed in a controlled manner to
28 Rajasthan 19 incineration and other equipments.
29 Sikkim 0 This is reflected in the design of MSW
30 Tamil Nadu 53 handling and feeding systems and has
31 Tripura 1 a significant knock-on effect on the
32 Uttar Pradesh 72 difficulties encountered in the control
of the combustion conditions in a
33 Uttarakhand 5
34 West Bengal 32 conventional incineration plant.
» MSW is also a high slagging and
Total 500 fouling fuel, that is, it has a high
Source: Lok Sabha Report on Waste to Energy
propensity to form fused ash deposits
accounted for 88.2% of total market lead installation capacity within Europe. on the internal surface of furnace
revenue in 2013. The Asia-Pacific market is dominated and high temperature reactor, and to
Europe is the largest and most by Japan which uses up to 60% of its form bonded fouling deposits on heat
sophisticated market for waste-to- solid waste for incineration. However, exchanger surfaces.
energy technologies, accounting for the fastest market growth has been » Arranging for higher costs for
47.6% of total market revenue in 2013. witnessed in China which has more than implementation of waste to energy
Increasing industrial waste, coupled doubled its waste-to-energy capacity in project is another challenge for India.
with stringent EU-wide waste legislation, the period 2011–2015. In most cases the cost of energy from
have been the major drivers for the On the other hand, market growth waste is more expensive compared
European market. Switzerland, Germany, in the developing economies of to that from fossil fuel. The thermal
Sweden, Austria, and the Netherlands Sub-Saharan Africa has been largely processes of energy recovery from
energy future 19 July–September 2018